Jzy3d Logarithm Toolbox allows drawing 3d charts with log scales very easily.
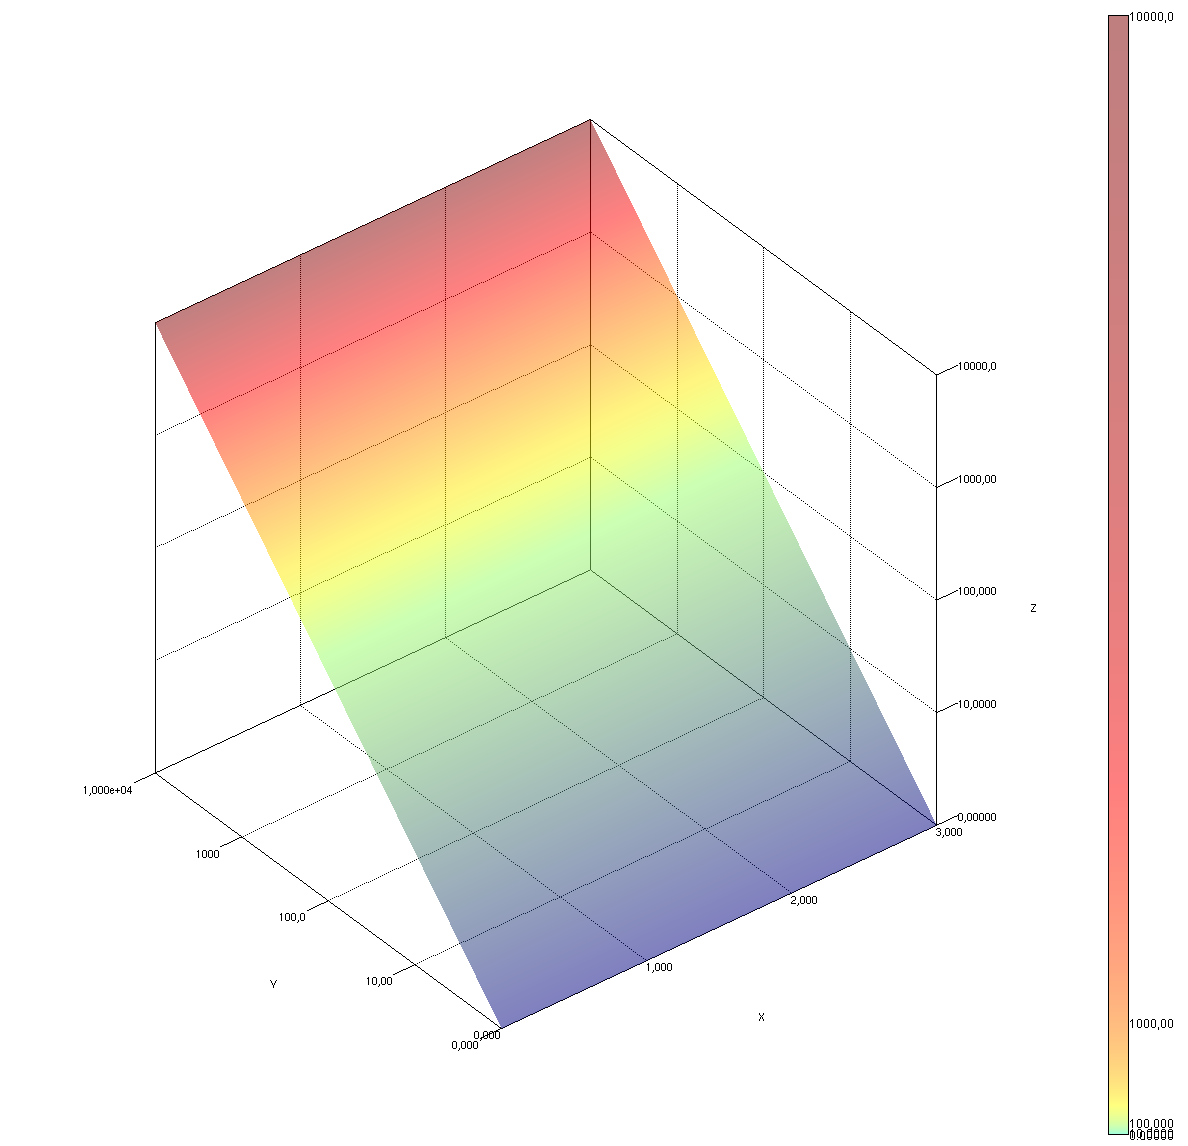
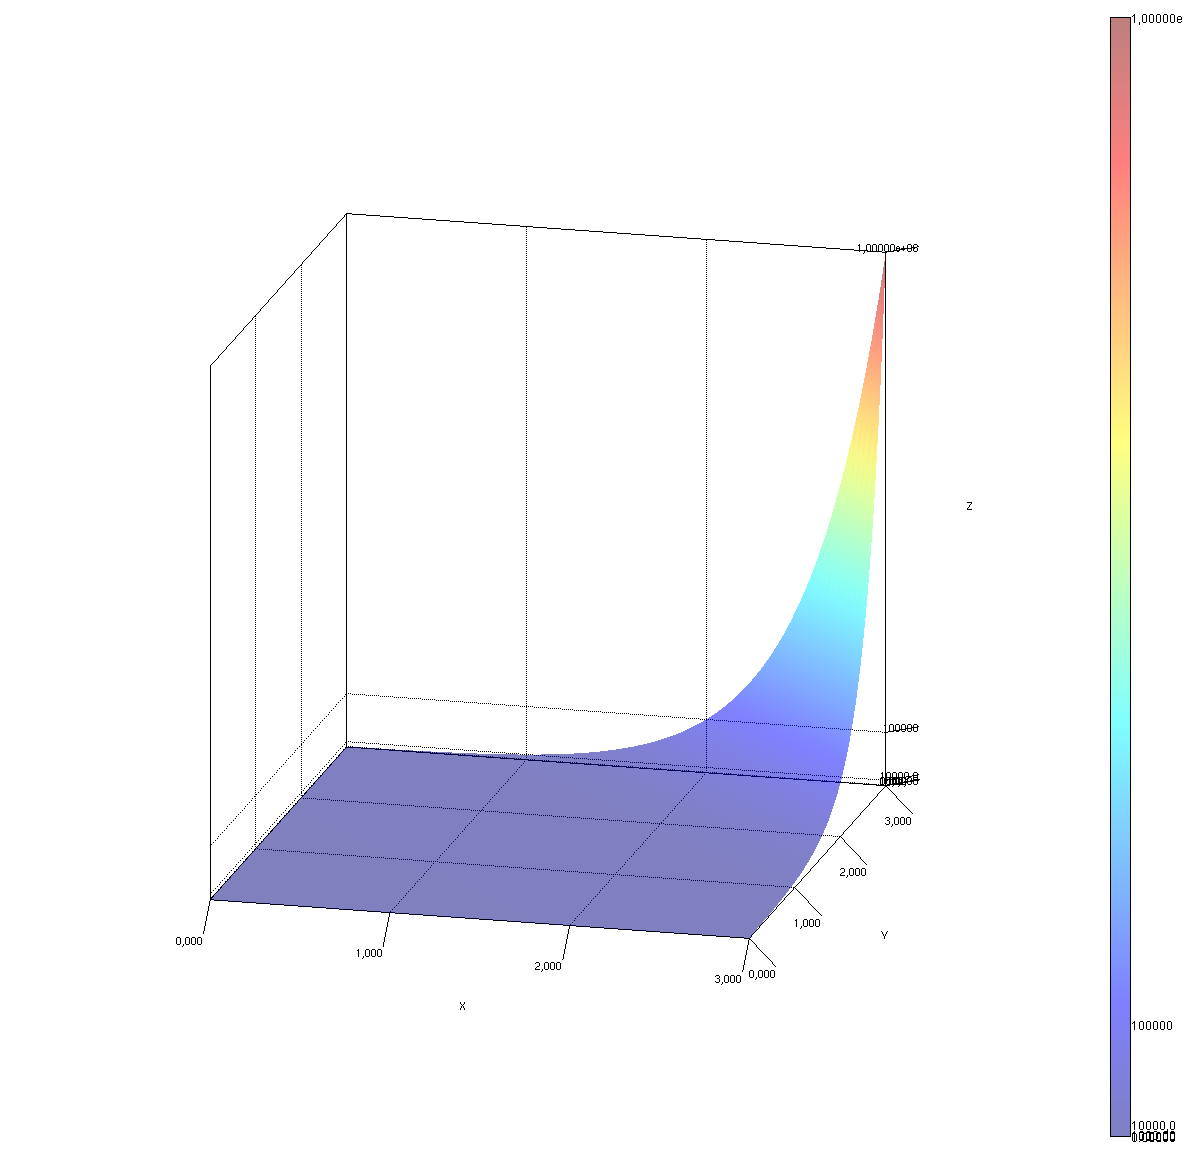
The below charts represent the f(x,y) = 10x+y function for x in [0;3] and y in [0;3]. It grows exponentially on Z and is a good example of log scales for Z axes.
Standard chart with linear scale
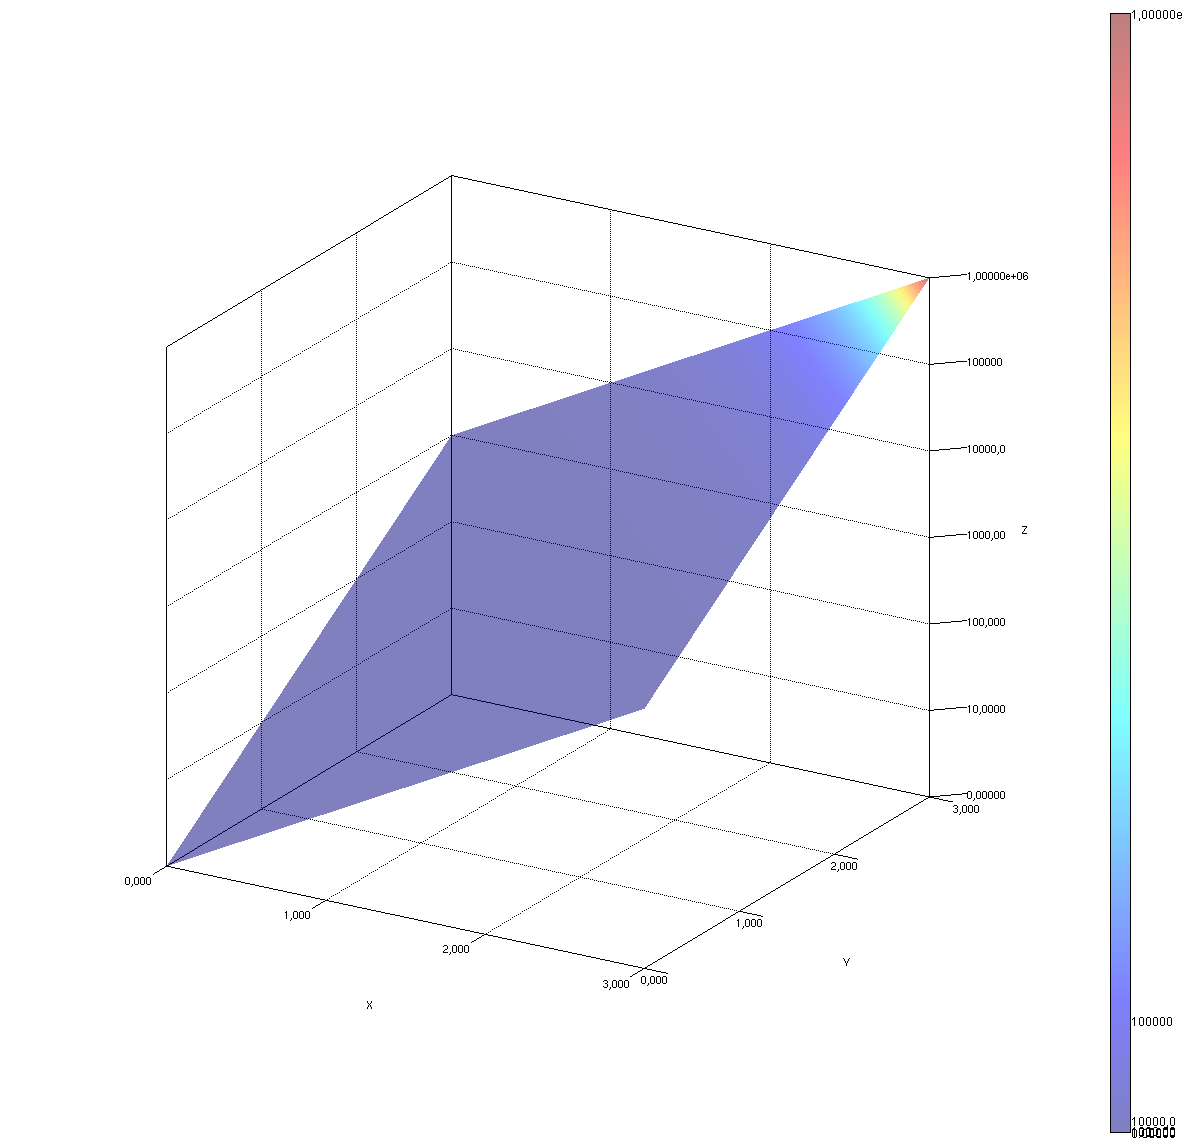
Log chart with linear coloring
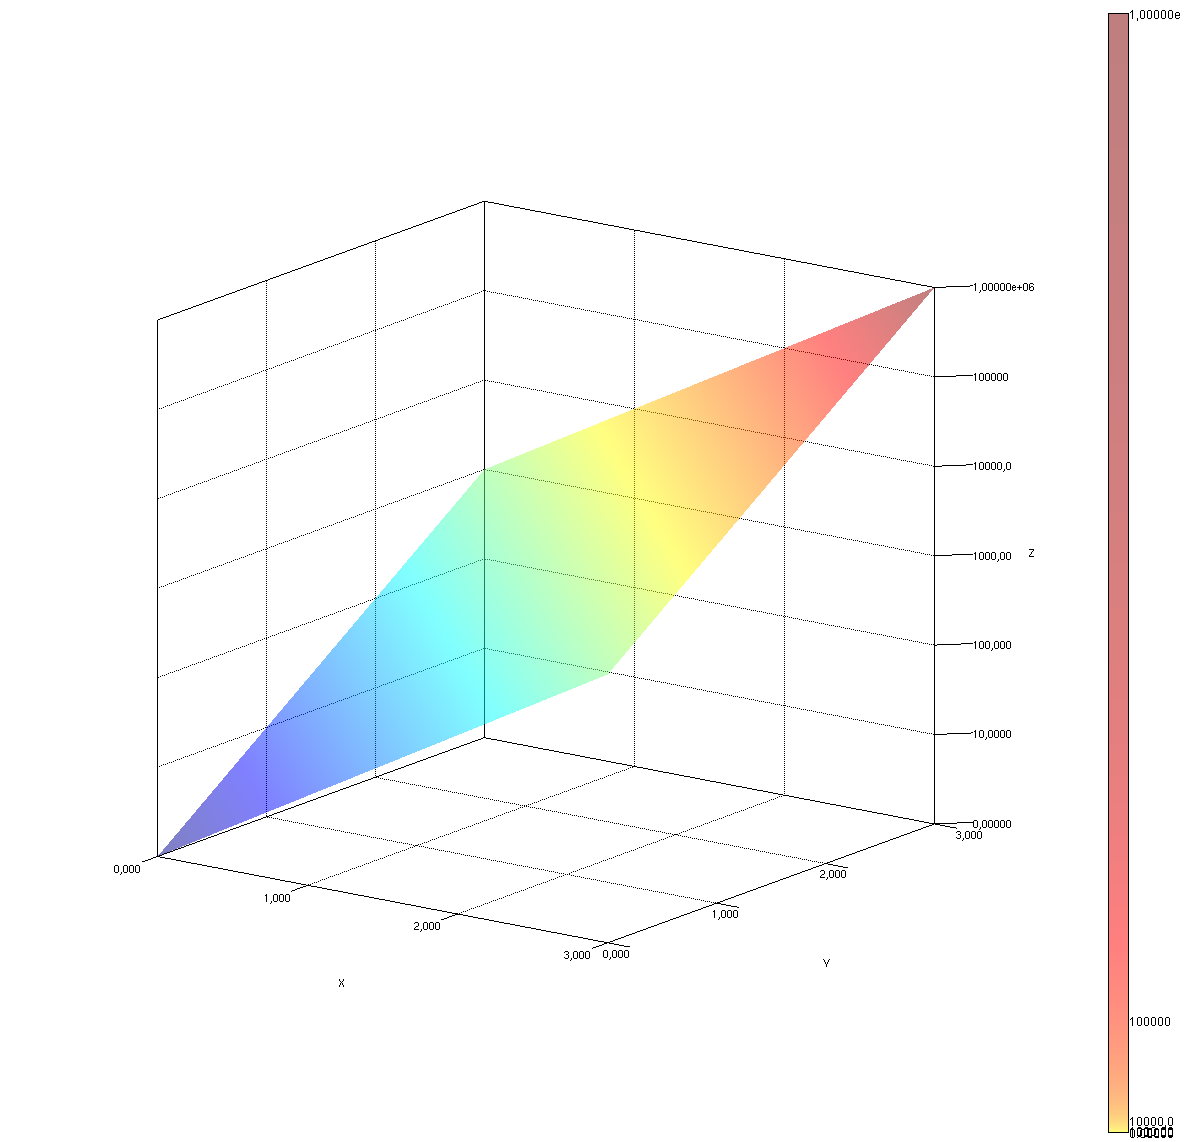
Log chart with log coloring
The below code shows how easy it is to enable log scales for the Y axis as well. Here we draw function f(x,y)=y having x in [0;3] and y in [0;10 000].
Code
SpaceTransformer spaceTransformer = new SpaceTransformer(
        null,                      // LINEAR scale on X axis
        new SpaceTransformLog10(), // LOG10 scale on Y axis
        new SpaceTransformLog10()  // LOG10 scale on Z axis
);

LogChartComponentFactory f = new LogChartComponentFactory(spaceTransformer);

// -----------------------------------------------------
// Define a function to plot
Mapper mapper = new Mapper() {
    @Override
    public double f(double x, double y) {
        return y;
    }
};

// Define range and precision for the function to plot
Range xRange = new Range(0, 3);
Range yRange = new Range(0, 10000);
int steps = 80;

// Create the object to represent the function over the given range.
IColorMap colormap = new LogColorMapRainbow();
colormap.setSpaceTransformer(spaceTransformer);
Shape surface = Surface.shape(mapper, xRange, yRange, steps, colormap, .5f);

// -----------------------------------------------------
// Create a chart and add drawables
Chart chart = f.newChart(Quality.Advanced, "awt");
chart.add(surface);
chart.getView().setBoundMode(ViewBoundMode.AUTO_FIT);
float[] logTicks = { 0.0f, 10.0f, 100.0f, 1000.0f, 10000.0f};
chart.getView().getAxe().getLayout().setYTickProvider(new StaticTickProvider(logTicks));
chart.getView().getAxe().getLayout().setZTickProvider(new StaticTickProvider(logTicks));
chart.getView().setSquared(true);

// Setup a colorbar
AWTColorbarLegend cbar = new AWTColorbarLegend(surface, chart.getView().getAxe().getLayout());
cbar.setMinimumSize(new Dimension(100, 600));
surface.setLegend(cbar);

//--------------
ChartLauncher.openChart(chart, new Rectangle(0, 0, 600, 600));
Purchase
Lite Edition
Small business Edition
Enterprise Edition
Package
Code examples
SDK Binaries
Documentation
Package
Code examples
SDK Sources
SDK Binaries
Documentation
Package
Code examples
SDK Sources
SDK Binaries
Documentation
Technical support
Licence 1 (SDK binaries)
Freely distribute SDK binaries inside your product without royaltees
Licence 2 (SDK binaries and sources)
Freely distribute SDK binaries inside your product without royaltees (Licence 1)
Lifetime access to SDK source code
1 years access to source code updates
Customize SDK for your needs
Can not distribute source code of SDK to any party, whatever your enclosing
software licence or commercial conditions. However, in case you have to distribute source code
of the API to your clients, please contact us : we remain
open to adapt licence on a per client basis.
Licence 3 (Support)
License 1
License 2
40 hours of technical support and consulting during the course of your project.
Price : 490 euros
Price : 1490 euros
Price : 4490 euros
In case download did not start immediately after you completed the Paypal payement, please contact us
Marcos González Gallego - Software developer
As part of the development of a new ElectroChemistry analyzer, we needed to modify the way we are creating some 3D charts.
It was necessary to have the possibility of display the capture data into charts with logarithmic representation.
We used jzy3d for a very long time so we talk with them to view the possibility to have this kind of charts.
Jzy3D team was very efficient with the response. They had developed a new version of the library that does what we need.
They confirmed with some examples that their solution is what we were searching and gave us support in all the refactoring process.
Finally, we made the changes in just a few days! Very fast and very easy!