Jzy3d is an open source java library that allows to easily draw 3d scientific data: surfaces,
scatter plots, bar charts, and lot of other 3d primitives. The API provides support for rich interactive charts,
with colorbars, tooltips and overlays. Axis and chart layout can be fully customized and enhanced.
Relying on JOGL 2, you can easily deploy native
OpenGL charts on Windows, Unix, MacOs and integrate into Swing, AWT, SWT or JavaFX.
Various contributions have also made Jzy3d available for other languages/platforms such as Scala, Groovy, Matlab, C#.
The API can be used freely in commercial applications.
You can download and try the API samples.
A tutorial shows how to display scatters and surfaces.
An extended developper guide with many code examples is also available.
Multiple chart types
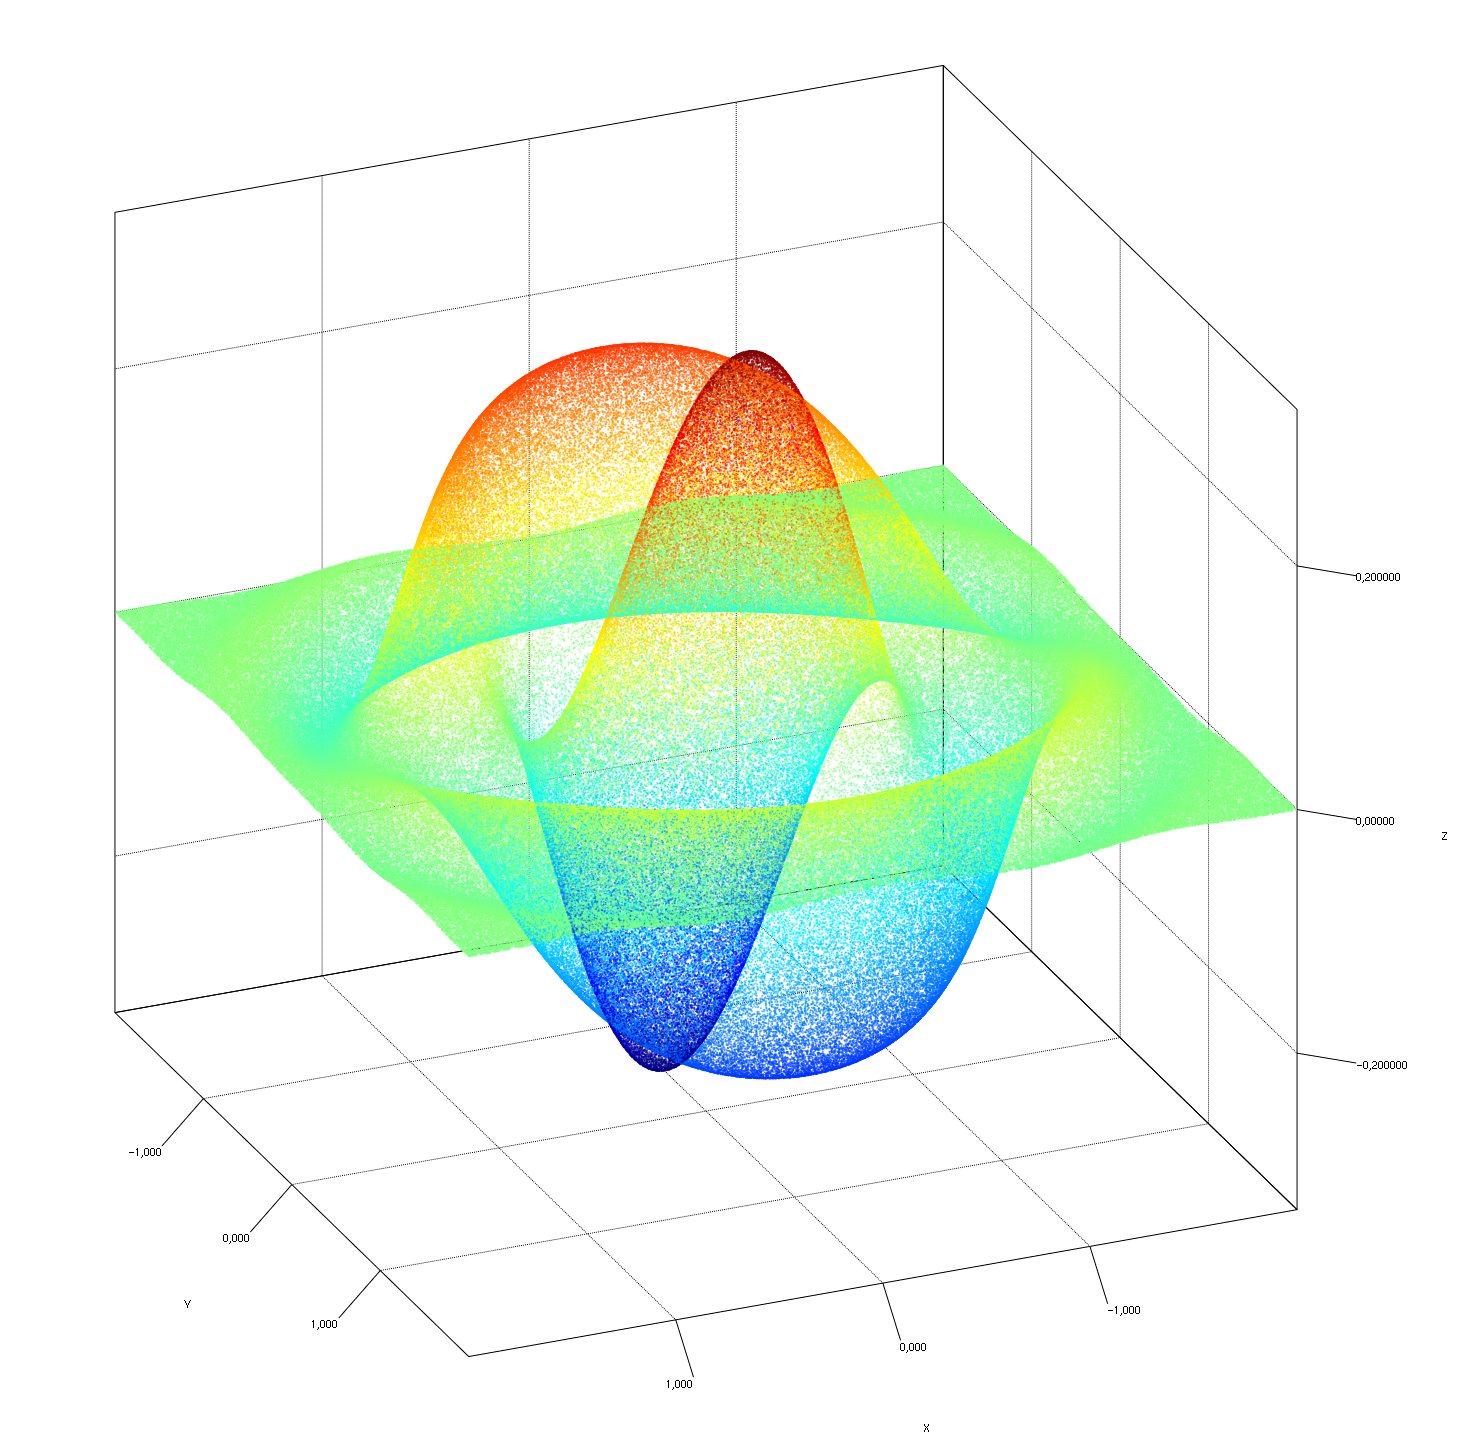
Surface charts
Bar charts
Scatter charts
2d & 3d graphs charts
Rich chart options
Many primitives (spheres, triangles, polygons, ...)
Easy to use
// Define a function to plot
Mapper mapper = new Mapper() {
	public double f(double x, double y) {
		return 10 * Math.sin(x / 10) * Math.cos(y / 20);
	}
};

// Define range and precision for the function to plot
Range range = new Range(-150, 150);
int steps = 50;

// Create a surface drawing that function
Shape surface = Builder.buildOrthonormal(new OrthonormalGrid(range, steps), mapper);
surface.setColorMapper(new ColorMapper(new ColorMapRainbow(), surface.getBounds()));
surface.setFaceDisplayed(true);
surface.setWireframeDisplayed(false);
surface.setWireframeColor(Color.BLACK);

// Create a chart and add the surface
Chart chart = new AWTChart(Quality.Advanced);
chart.add(surface);
chart.open("Jzy3d Demo", 600, 600);
Flexible layout
Colorbars
Colormappers for coloring objects
Axe box layout with detailed tick definition and tick rendering tools
Contour functions
Tooltips
Background images
2D post renderers
Lights
Algorithms
Grid based and Delaunay surface tesselation methods
3d line strip interpolation to smooth pathes (Bernstein 3d)
2d envelopes (Convex hulls)
Polygon ordering for improved transparency rendering
Dual depth peeling: scene graph order independent transparency (expected for 1.0)
Matlab-like array processors and statistics tools
Experimental Support Vector Machine integration (Svm3d)
Interactions
Mouse interaction with objects (selection & picking methods)
Mouse interaction with chart (rotation, zoom, scale)
Key interaction with chart (rotation, zoom, scale)
Thread Controllers
Animation of objects' structures (surface, series of lines, etc)
High and low level OpenGL programming
Hide complexity and provide out of the box solutions for common low level OpenGL tasks.
Fully cutomizable framework with access to all OpenGL native features through JOGL.
Cross platforms and compatible
Straightforward integration to either AWT, Swing, Eclipse RCP (SWT), or JavaFX
Windows, Unix, and MacOS. Android supposed to work if enable appropriate JOGL jars
Jzy3d Enterprise SDKs provide out of the box solutions to hard 3d programming problems, avoiding to re-develop what has been done multiple time.
We capitalize on multiple clients requirements to grow frameworks for software vendors that need advanced 3d charting without pain.
Licence is very flexible with no royaltee. We gladly share updates of each SDK to their users.
There are lite versions for small budgets which come without source code.
SurfEdit
SurfEdit let you edit surface mesh using a mouse click and drag.
The surface is also presented in an excel-like table that is synchronized with drawing : table update when mesh is changed with mouse,
surface updates when table cells are edited. The table has smart pair of column scroll and resize widgets to easily navigate on the 2d table-surface.
The toolkit provides dedicated sphere axis replacing traditional cube axis.
Polar tesselation allows loading scan with increasing azimuth then elevation values.
A dedicated polar dataset allows to easily make operations on the coordinates (arithmetic or conversions) .
Logarithm let you build 3d charts with log scale on any of the 3 axes.
The force of log scale in Jzy3d is that it may be applied to any kind of chart, as the principle of
applying space scaling as been defined in the core API. Logarithm SDK provides dedicated axis, views,
ordering strategies and colormaps suitable for clean logarithmic charts.
The toolkit provides a dedicated ternary axis replacing traditional cube axis.
The ternary surfaces are built using a dedicated data structure based on ternary statistics
(which basically holds the three components and one variable that is used to define the Z value of a ternary point).
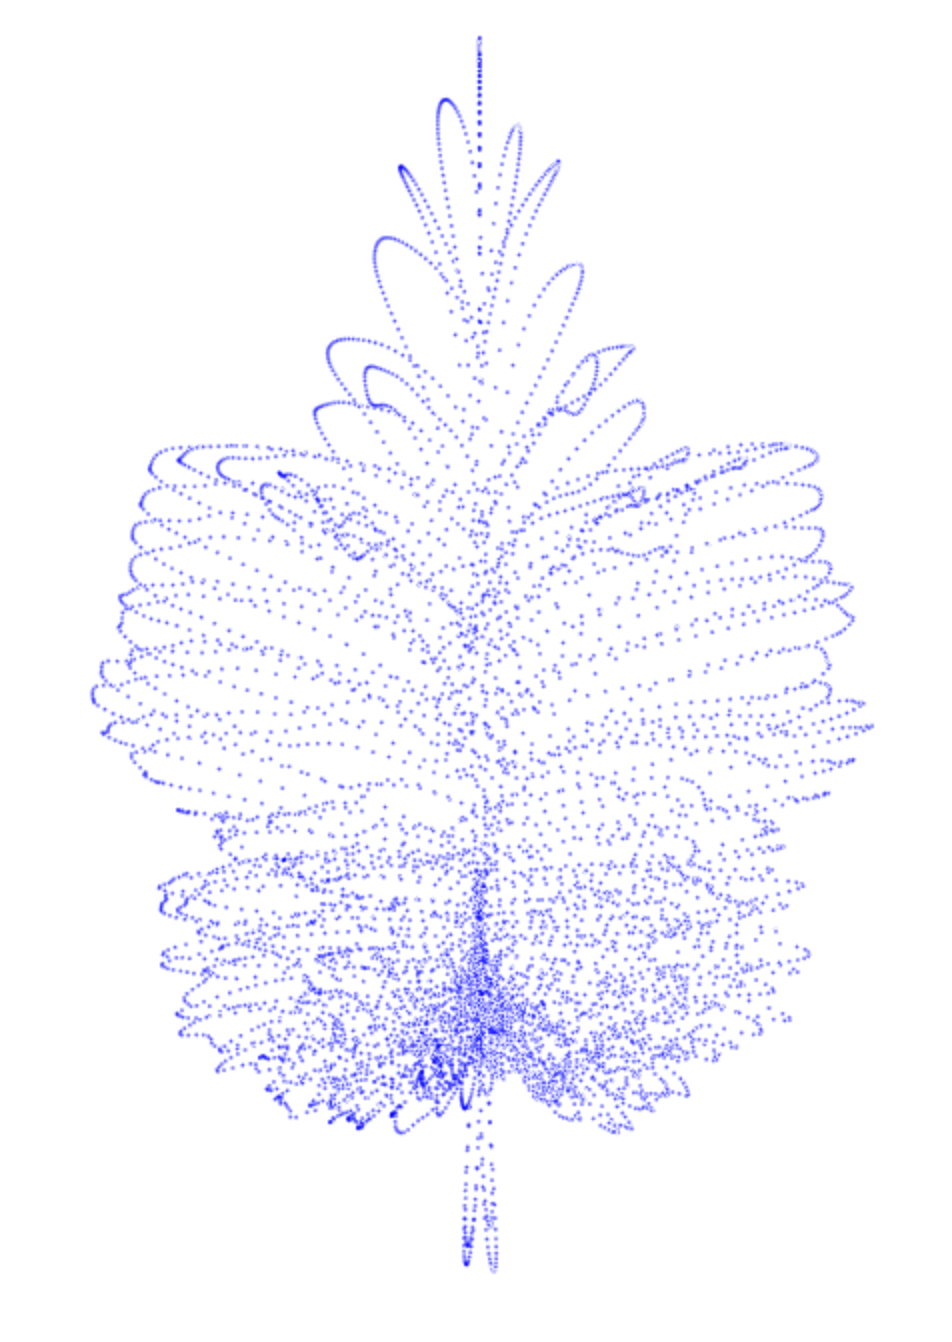
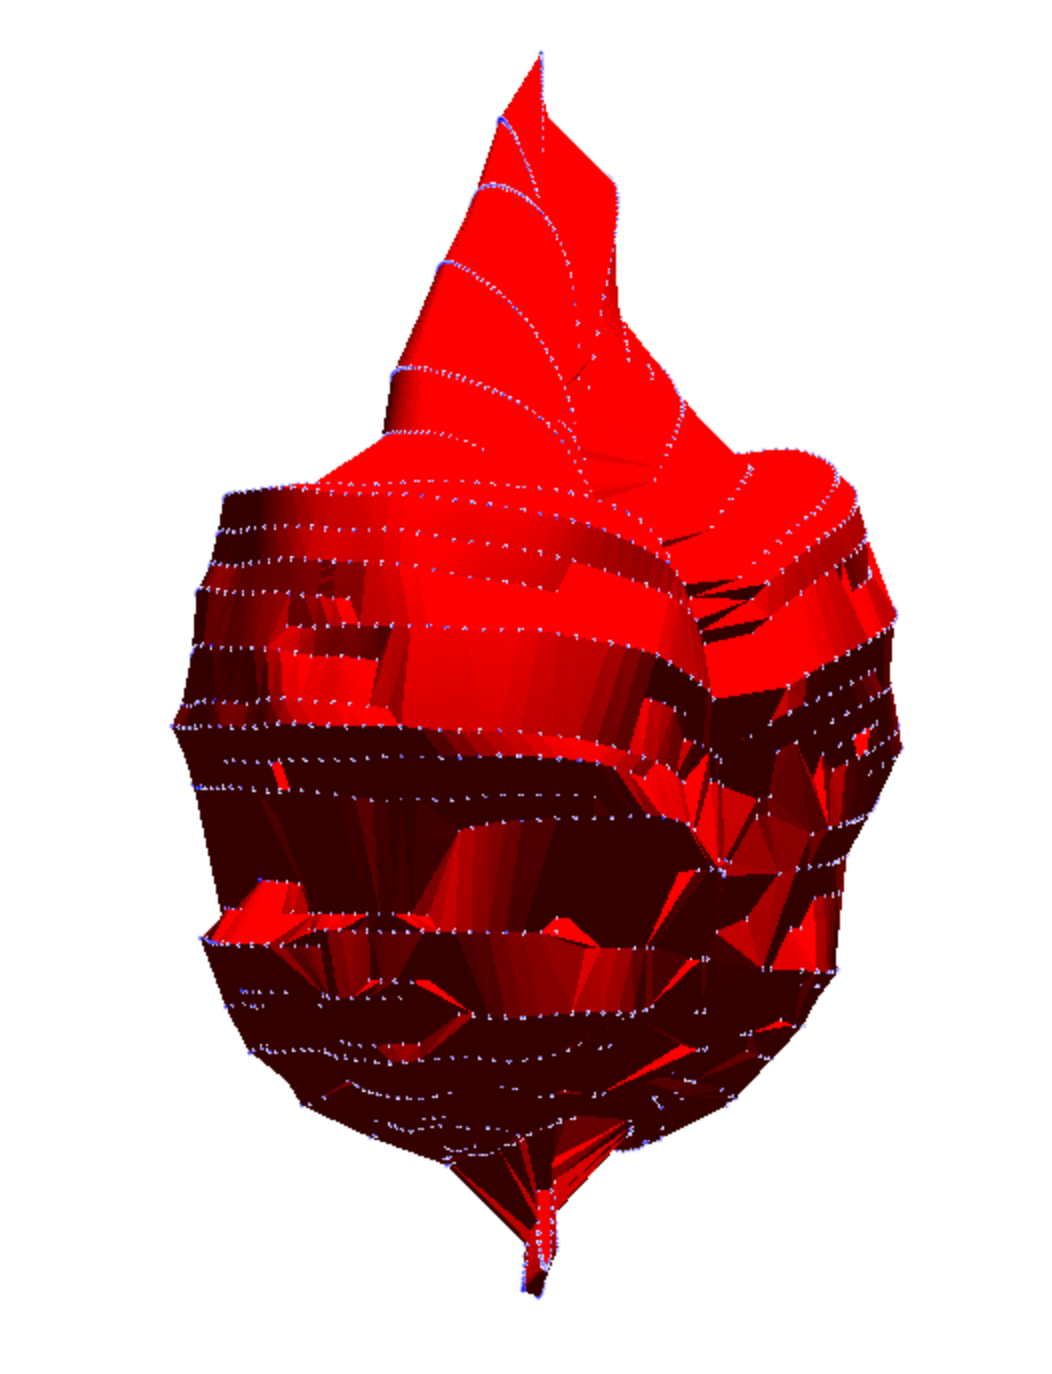
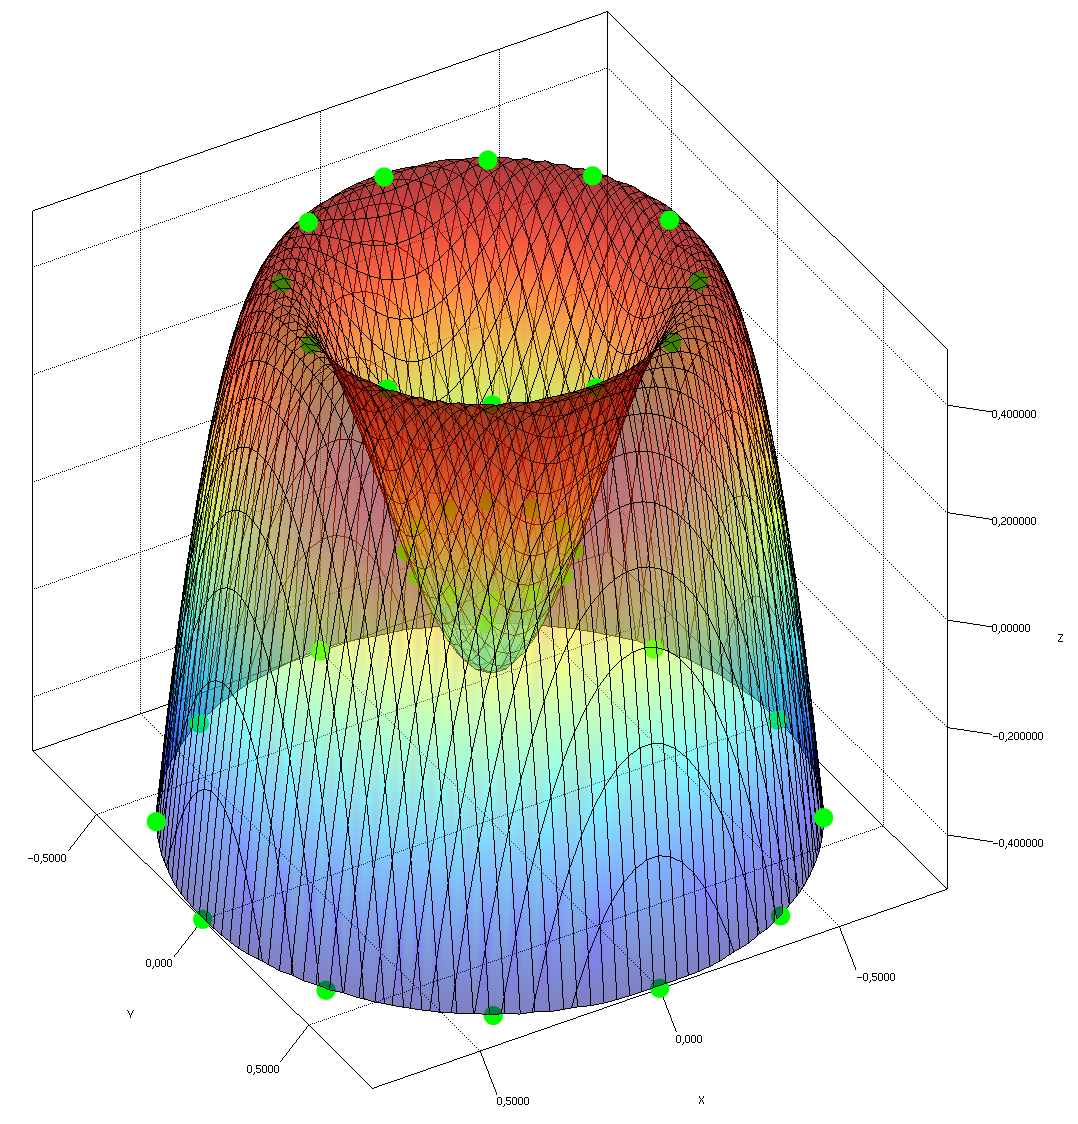
Envelope allows building shape meshes out of unorganized input points.
Building surface or shape meshes assumes a particular point organization as input
(e.g. orthonormal tesselator requires point to stand on a regulat grid in increading X and Y order).
When input points are not organized or scan logic is to complicated to implement in a tesselation algorithm,
Envelope helps building the contour of a point cloud.
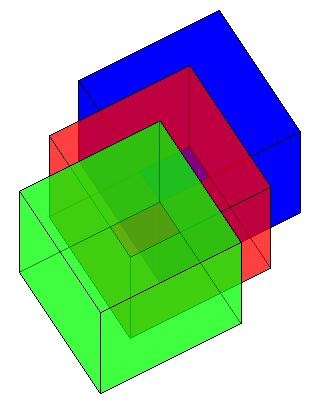
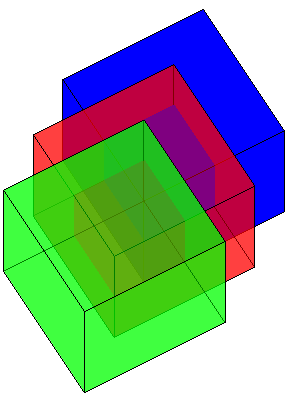
Intersect allows processing the intersection of multiple 3d polygons.
This toolkit is usefull for processing intersection between two shapes. It can also be used to
calculate the contour levels of a surface which has been defined out or arbitrary sampled point and which
has no known formula.
BigPicture provides few drivers to big data storage to help draw massive amount of points.
You don't have to care about resultset size : chart won't freeze with dataset size.
Drawables use OpenGL Vertex Buffer Objects to load data in GPU once and render smoothly afterward.
Readers have been implemented for HBase, Hive and Spark.
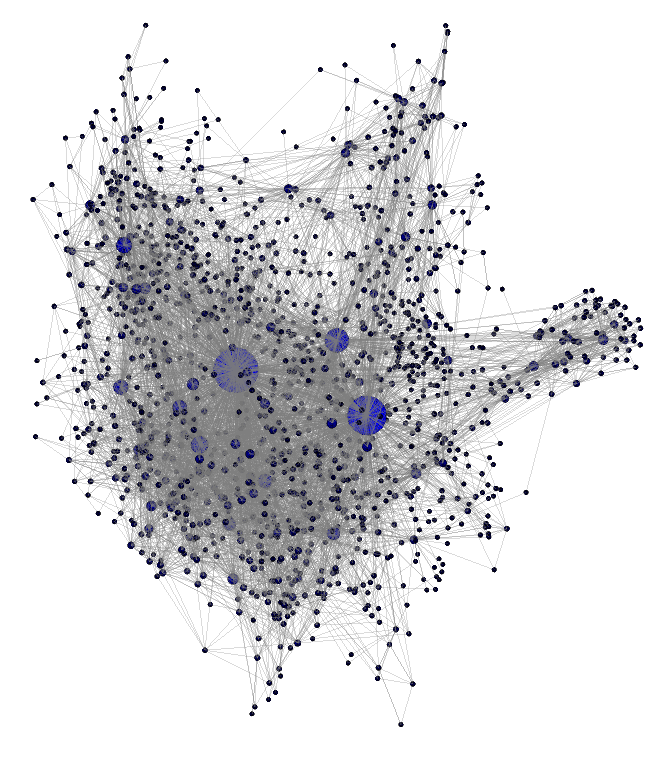
Graphs allows processing layouts of 3d graphs and draw them.
We derive Gephi Toolkit and simply add a dimension to most of the existing force based layouts
(ForceAtlas3d,
OpenOrd3d).
Demonstrations show how the Gephi Toolkit is wrapped to simplify data binding between Jzy3d and Gephi.
Svm3D allows building a surface out of the regression of an input point cloud.
Support Vector Machine can process good surface regression of N-dimensional vectors.
Svm3d estimates a surface from an input 3d scatter. The estimated surface minimize a global error to input training point.
This extension is based on the Java port of LibSVM which allows retrieving and drawing the model internal state.